meshgrid() 方法接受两个或多个表示坐标值的 1D 数组,并返回一对 2D 数组的矩形网格。
示例
import numpy as np

# 1D arrays as x and y coordinates
x = np.array([1, 2, 3])
y = np.array([10, 20])

# create a 2D grid using meshgrid
X, Y = np.meshgrid(x, y)

# print the created grid
print("X values:\n", X)
print("\nY values:\n", Y)

'''
Output:
X values:
[[1 2 3]
 [1 2 3]]

Y values:
 [[10 10 10]
 [20 20 20]]
'''
给定两个数组 x 和 y,meshgrid() 返回一个数组,其中包含所有可能的坐标点 (xi, yi),对于 x 中的所有 xi 和 y 中的所有 yi。
meshgrid() 语法
meshgrid() 的语法是
numpy.meshgrid(*xi, copy = True, sparse = False, indexing = 'xy')meshgrid() 参数
meshgrid() 方法接受以下参数
*xi- 表示网格坐标的一维数组indexing(可选)- 指定网格的索引('xy'(笛卡尔,默认)或'ij'(矩阵))sparse(可选)-一个bool值,如果为True,则返回稀疏网格copy(可选)- 如果为True(默认),则创建副本;如果为False,则返回视图
meshgrid() 返回值
meshgrid() 方法从坐标向量返回坐标矩阵。
示例 1:创建二维网格
import numpy as np

# create 1D arrays
x = np.array([1, 2, 3])
y = np.array([1, 2, 3])

# create a 2D grid using meshgrid
X, Y = np.meshgrid(x, y)

# print the created grid
print("X values:\n", X)
print("Y values:\n", Y)
输出
X values:
[[1 2 3]
 [1 2 3]
 [1 2 3]]
Y values:
 [[1 1 1]
 [2 2 2]
 [3 3 3]]
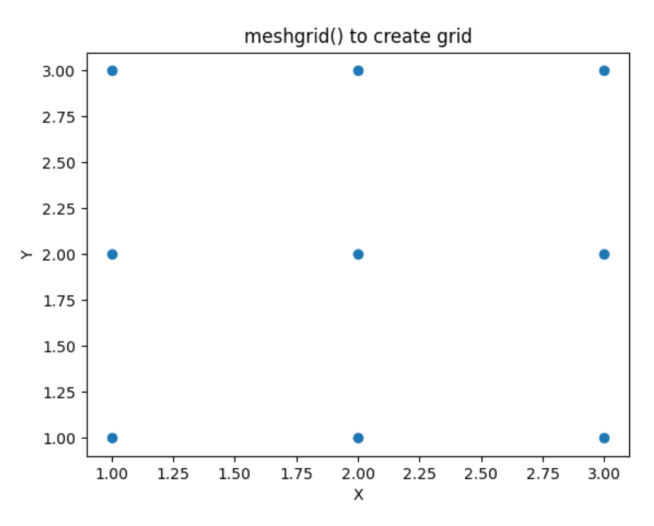
该代码创建了一个二维网格,其中 X 和 Y 的值表示网格点的坐标。
X 数组表示网格点的 x 坐标,其中每行包含相同的 x 值 [1, 2, 3]。Y 数组表示网格点的 y 坐标,其中每列包含相同的 y 值 [1, 2, 3]。
要可视化 meshgrid() 的结果,我们可以使用 matplotlib。
import numpy as np
import matplotlib.pyplot as plt

# create 1D arrays
x = np.array([1, 2, 3])
y = np.array([1, 2, 3])

# create a 2D grid using meshgrid
X, Y = np.meshgrid(x, y)

# create a scatter plot
plt.scatter(X, Y)

# set labels and title
plt.xlabel('X')
plt.ylabel('Y')
plt.title('meshgrid() to create grid')

# show the plot
plt.show()
输出

示例 2:二维网格中的索引
在 NumPy 的 meshgrid() 方法中,indexing 参数允许您指定使用的索引方案。
meshgrid() 有两个 indexing 选项:'xy' 和 'ij'。
在 xy 索引方法中,第一个索引引用行(y 坐标),第二个索引引用列(x 坐标)。
在 ij 索引方法中,第一个索引引用列(i 坐标),第二个索引引用行(j 坐标)。
让我们看一个例子。
import numpy as np

# create 1D arrays
x = np.array([1, 2, 3])
y = np.array([10, 20])

# using xy indexing in meshgrid
XX, YY = np.meshgrid(x, y, indexing='xy')
print("Using xy indexing:")
print("XX values:\n", XX)
print("YY values:\n", YY)
print()

# using ij indexing in meshgrid
XX, YY = np.meshgrid(x, y, indexing='ij')
print("Using ij indexing:")
print("XX values:\n", XX)
print("YY values:\n", YY)
输出
Using xy indexing:
XX values:
[[1 2 3]
 [1 2 3]]
YY values:
 [[10 10 10]
 [20 20 20]]

Using ij indexing:
XX values:
 [[1 1]
 [2 2]
 [3 3]]
YY values:
 [[10 20]
 [10 20]
 [10 20]]
使用 indexing='xy' 时,第一个数组 XX 对应于 x 坐标,第二个数组 YY 对应于 y 坐标。
使用 indexing='ij' 时,第一个数组 XX 对应于 i 坐标,第二个数组 YY 对应于 j 坐标。
示例 3:在 meshgrid 中使用 sparse 参数
您可以创建稀疏输出数组以节省内存和计算时间。
import numpy as np

# create 1D arrays
x = np.array([1, 2, 4])
y = np.array([10, 20, 30, 40])

# create a  grid
XX, YY = np.meshgrid(x, y)
print("Grid: ")
print("XX values:\n", XX)
print("YY values:\n", YY)

# create a sparse grid
XX, YY = np.meshgrid(x, y, sparse=True)
print("Sparse Grid: ")
print("XX values:\n", XX)
print("YY values:\n", YY)
输出
Grid:
XX values:
[[1 2 4]
 [1 2 4]
 [1 2 4]
 [1 2 4]]
YY values:
 [[10 10 10]
 [20 20 20]
 [30 30 30]
 [40 40 40]]

Sparse Grid:
XX values:
 [[1 2 4]]
YY values:
 [[10]
 [20]
 [30]
 [40]]
相关主题
ogrid():一个 NumPy 函数,在您为每个维度指定开始、停止和步长值后,它会创建一个稀疏的多维值网格。
mgrid():一个 NumPy 函数,在您为每个维度指定开始、停止和步长值后,它会创建一个密集的多维值网格。
Let's look at an example.

import numpy as np

# using mgrid to create a dense multi-dimensional grid
mGridX, mGridY = np.mgrid[0:10:2, 0:5]

print('For mgrid,')
print('X values:\n', mGridX)
print('Y values:\n', mGridY)

# using ogrid to create an open multi-dimensional grid
oGridX, oGridY = np.ogrid[0:10:2, 0:5]

print('\nFor ogrid,')
print('X values:\n', oGridX)
print('Y values:\n', oGridY)
输出
For mgrid,
X values:
[[0 0 0 0 0]
 [2 2 2 2 2]
 [4 4 4 4 4]
 [6 6 6 6 6]
 [8 8 8 8 8]]
Y values:
 [[0 1 2 3 4]
 [0 1 2 3 4]
 [0 1 2 3 4]
 [0 1 2 3 4]
 [0 1 2 3 4]]

For ogrid,
X values:
[[0]
 [2]
 [4]
 [6]
 [8]]
Y values:
 [[0 1 2 3 4]]
