numpy.histogram() 方法计算数据集的直方图。
示例
import numpy as np

array1 = np.array([0, 12, 14, 17, 12, 4, 3, 3, 13, 12, 9, 17, 14, 11, 5, 20])

# compute histogram of array1
graph= np.histogram(array1)

print(graph)

# Output: (array([1, 2, 2, 0, 1, 1, 4, 2, 2, 1]), array([ 0.,  2.,  4.,  6.,  8., 10., 12., 14., 16., 18., 20.]))
histogram() 语法
numpy.histogram() 方法的语法是:
numpy.histogram(array, bins = 10, range = None, density = None, weights = None)histogram() 参数
numpy.histogram() 方法接受以下参数:
array- 输入数组 (array_like)bins(可选) - 范围内等宽的 bin 数量 (int或sequence of scalars或str)range(可选) - bin 的下限和上限 ((float, float))density(可选) - 指定返回的直方图值是否应被归一化以形成概率密度 (bool)weights(可选) - 与array形状相同的权重数组 (array_like)
histogram() 返回值
numpy.histogram() 方法返回直方图的值。
直方图
直方图以图形方式表示数值数据的频率分布。
直方图类似于条形图。但与条形图(表示绝对值)不同,直方图中的每个条形代表一个特定的范围。
在 NumPy 中,我们使用 histogram() 函数来计算数据的频率分布,然后可以将其以图形的形式显示出来。
示例 1:NumPy 直方图
如果我们为 bins 传递一个序列,该序列按升序排列,则充当分布的 bin 边缘。
import numpy as np

# create an array of data
data = np.array([5, 10, 15, 18, 20])

# create bin to set the interval
bin = [0,10,20,30]

# create histogram
graph = np.histogram(data, bin)

print(graph)
输出
(array([1, 3, 1]), array([ 0, 10, 20, 30]))
histogram() 方法返回一个包含两个数组的元组:
- 第一个数组包含每个 bin 内数据的频率计数。
- 第二个数组包含 bin 边缘。
在上面的示例中:
- 第一个 bin 的范围是 [0, 10),包含 1 个数据点(5)。
- 第二个 bin 的范围是 [10, 20),包含 3 个数据点(10, 15, 18)。
- 最后一个 bin 的范围是 [20, 30],包含 1 个数据点(20)。
示例 2:带范围的 NumPy 直方图
在之前的示例中,直方图的范围是从数组的最小值到最大值。
但是,我们可以使用 range 参数手动指定直方图的范围。
import numpy as np
array1 = np.array([0, 12, 14, 17, 12, 4, 3, 3, 13, 12, 9, 17, 14, 11, 5, 20])

# compute histogram from 0 to 30
graph= np.histogram(array1, range = (0, 30))

print(graph)
输出
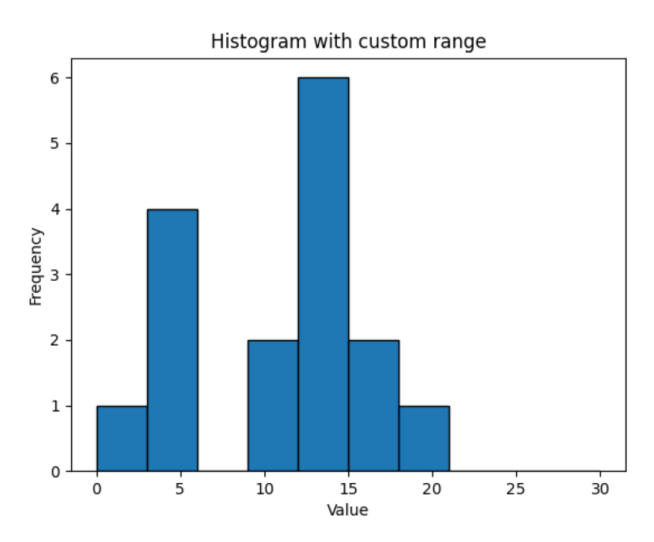
(array([1, 4, 0, 2, 6, 2, 1, 0, 0, 0]), array([ 0., 3., 6., 9., 12., 15., 18., 21., 24., 27., 30.]))
注意:range 中的开始和停止值都包含在 bins 中。
示例 3:带 density 的 NumPy 直方图
如果我们将 density 参数设置为 True (density = True),我们可以对返回的直方图值进行归一化以形成概率密度。
import numpy as np

array1 = np.array([0, 12, 14, 17, 12, 4, 3, 3, 13, 12, 9, 17, 14, 11, 5, 20])

# compute histogram
graph= np.histogram(array1)

print('Unnormalized Distribution:\n', graph)

# compute histogram with density = True
graph= np.histogram(array1, density = True)

print('Normalized Distribution:\n', graph)
输出
Unnormalized Distribution:
(array([1, 2, 2, 0, 1, 1, 4, 2, 2, 1]), array([ 0.,  2.,  4.,  6.,  8., 10., 12., 14., 16., 18., 20.]))
Normalized Distribution:
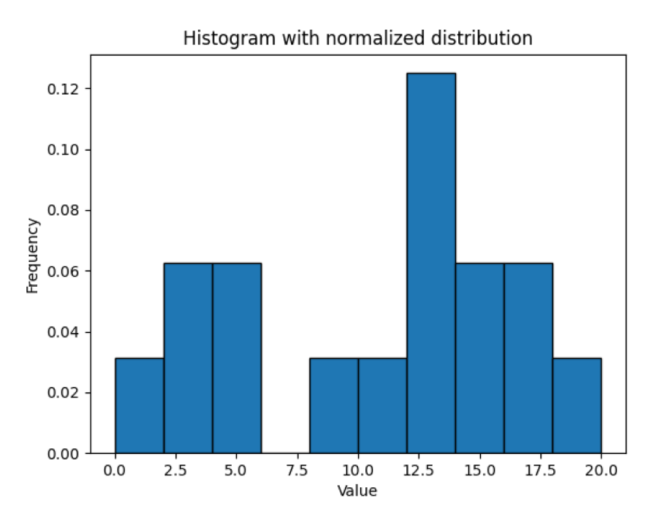
(array([0.03125, 0.0625 , 0.0625 , 0.     , 0.03125, 0.03125, 0.125  ,
       0.0625 , 0.0625 , 0.03125]), array([ 0.,  2.,  4.,  6.,  8., 10., 12., 14., 16., 18., 20.]))
示例 4:带 weights 的 NumPy 直方图
理想情况下,数组的所有元素在直方图中具有相等的权重。但是,我们可以使用 weights 参数为每个元素分配权重。
import numpy as np

array1 = np.array([0, 12, 14, 17, 12, 4, 3, 3, 13, 12, 9, 17, 14, 11, 5, 20])

# compute histogram
graph= np.histogram(array1)

print('Equal Weights:\n', graph)

# compute histogram with even weights = 1 and odd weights = 0
weights = np.where(array1 % 2 == 0, 1, 0)
graph= np.histogram(array1, weights = weights)

print('Weighted Distribution:\n', graph)
输出
Equal Weights:
(array([1, 2, 2, 0, 1, 1, 4, 2, 2, 1]), array([ 0.,  2.,  4.,  6.,  8., 10., 12., 14., 16., 18., 20.]))
Weighted Distribution:
(array([1, 0, 1, 0, 0, 0, 3, 2, 0, 1]), array([ 0.,  2.,  4.,  6.,  8., 10., 12., 14., 16., 18., 20.]))
示例 5:直方图可视化
我们可以使用 matplotlib 来可视化直方图数据。
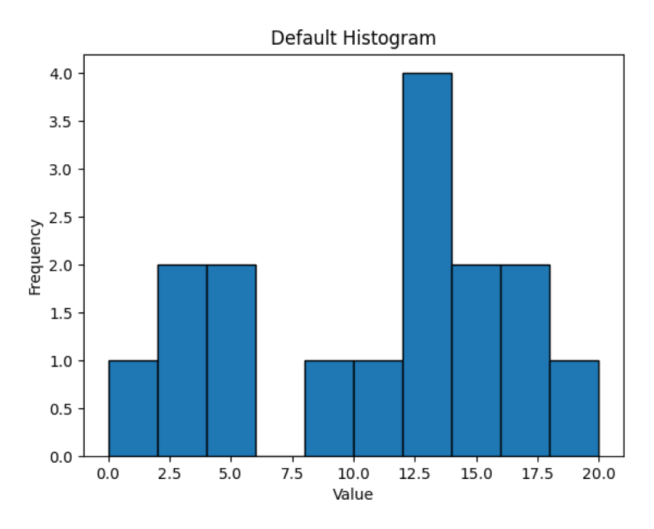
默认直方图
import numpy as np
import matplotlib.pyplot as plt

# define array
array1 = np.array([0, 12, 14, 17, 12, 4, 3, 3, 13, 12, 9, 17, 14, 11, 5, 20])

# compute histogram
counts, bin_edges = np.histogram(array1)

# plot histogram using counts and bin_edges
plt.bar(bin_edges[:-1], counts, width=np.diff(bin_edges), align='edge', edgecolor='black')
plt.title('Default Histogram')
plt.xlabel('Value')
plt.ylabel('Frequency')

plt.show()
输出
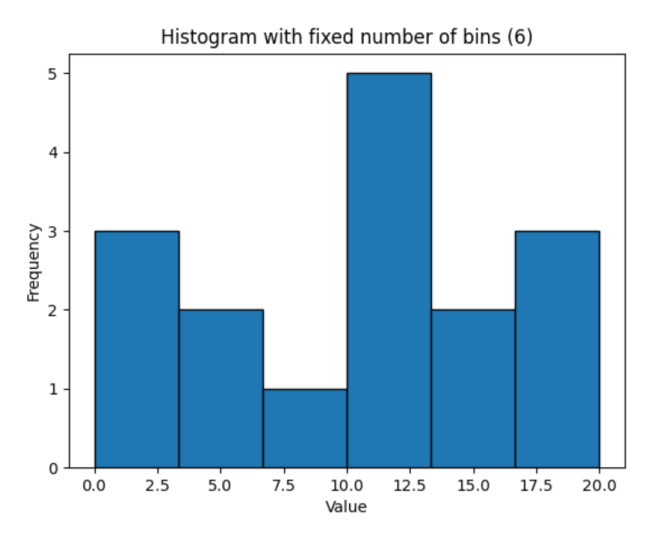
具有固定 bin 数的直方图
import numpy as np
import matplotlib.pyplot as plt

# define array
array1 = np.array([0, 12, 14, 17, 12, 4, 3, 3, 13, 12, 9, 17, 14, 11, 5, 20])

# compute histogram by specifying the number of bins(6)
counts, bin_edges = np.histogram(array1, bins=6)

# plot histogram using counts and bin_edges
plt.bar(bin_edges[:-1], counts, width=np.diff(bin_edges), align='edge', edgecolor='black')
plt.title('Histogram with fixed number of bins (6)')
plt.xlabel('Value')
plt.ylabel('Frequency')

plt.show()
输出
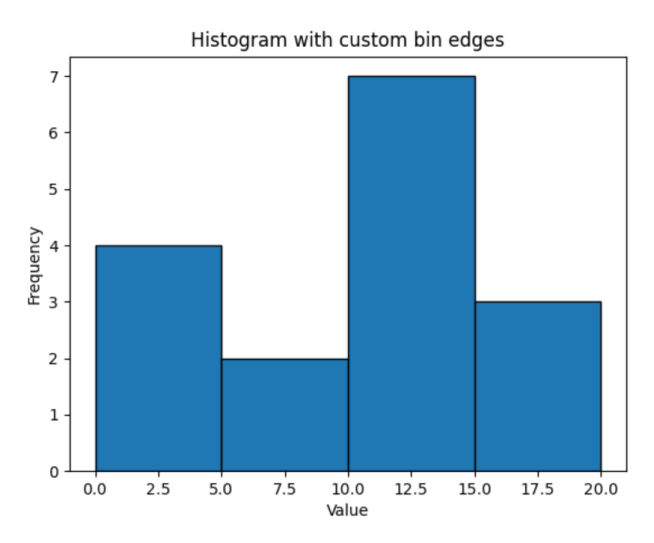
具有自定义 bin 边缘的直方图
import numpy as np
import matplotlib.pyplot as plt

# define array
array1 = np.array([0, 12, 14, 17, 12, 4, 3, 3, 13, 12, 9, 17, 14, 11, 5, 20])

# create custom bin edges
bins = [0, 5, 10, 15, 20]
counts, bin_edges = np.histogram(array1, bins=bins)

# plot histogram using custom bin edges
plt.bar(bin_edges[:-1], counts, width=np.diff(bin_edges), align='edge', edgecolor='black')
plt.title('Histogram with custom bin edges')
plt.xlabel('Value')
plt.ylabel('Frequency')

plt.show()
输出
具有自定义范围的直方图
import numpy as np
import matplotlib.pyplot as plt

# define array
array1 = np.array([0, 12, 14, 17, 12, 4, 3, 3, 13, 12, 9, 17, 14, 11, 5, 20])

# compute histogram with fixed range (0 to 30)
counts, bin_edges = np.histogram(array1, range=(0, 30))

plt.bar(bin_edges[:-1], counts, width=np.diff(bin_edges), align='edge', edgecolor='black')
plt.title('Histogram with custom range')
plt.xlabel('Value')
plt.ylabel('Frequency')

plt.show()
输出
具有归一化分布的直方图
import numpy as np
import matplotlib.pyplot as plt

# define array
array1 = np.array([0, 12, 14, 17, 12, 4, 3, 3, 13, 12, 9, 17, 14, 11, 5, 20])

# compute histogram with density
counts, bin_edges = np.histogram(array1, density=True)

plt.bar(bin_edges[:-1], counts, width=np.diff(bin_edges), align='edge', edgecolor='black')
plt.title('Histogram with normalized distribution')
plt.xlabel('Value')
plt.ylabel('Frequency')

plt.show()
输出
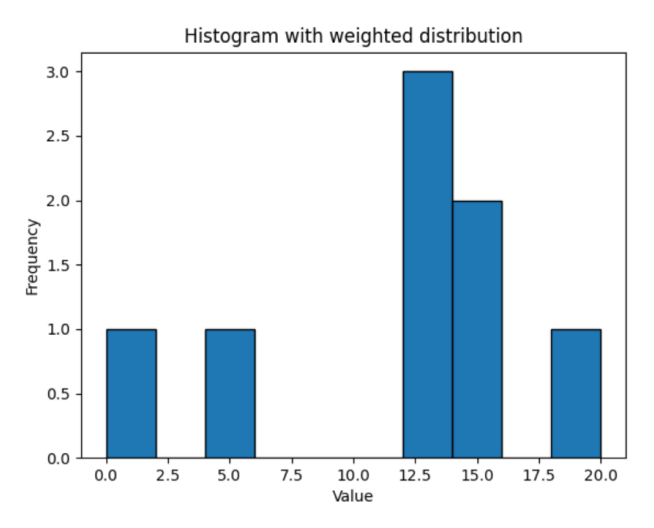
具有加权分布的直方图
import numpy as np
import matplotlib.pyplot as plt

# define array
array1 = np.array([0, 12, 14, 17, 12, 4, 3, 3, 13, 12, 9, 17, 14, 11, 5, 20])

# compute histogram with even weights = 1 and odd weights = 0
weights = np.where(array1 % 2 == 0, 1, 0)
counts, bin_edges = np.histogram(array1, weights=weights)

plt.bar(bin_edges[:-1], counts, width=np.diff(bin_edges), align='edge', edgecolor='black')
plt.title('Histogram with weighted distribution')
plt.xlabel('Value')
plt.ylabel('Frequency')

plt.show()
输出
